May 2015, Toronto
Reading time: 15-20 minutes
Introduction
Growing up, I always heard that there were six million Tibetans. However, I could not find a proper source for this claim other than those based on anecdotal evidences. If you find a credible source, I would be happy to be corrected. The Central Tibetan Administration ("CTA") or formerly, Tibetan Government-in-exile, website states that the "total Tibetan population in Tibet is 6 million" and 2.09 million live in the Tibet Autonomous Region ("TAR"). This Chinese embassy in Iceland states that Tibet's (meaning TAR) population "stood at 2.84 million at end of 2007" of which 2.5 million were Tibetans. Go figure!
Background notes and methodology
This project began when I was on the board of the Tibetan Canadian Cultural Centre. We had just started our membership campaign (monthly donations) and there were no other numbers for comparison to understand how high or low our target should be. I spent some time on the Statistics Canada website and found that they provided detailed breakdown on the languages spoken at home. The Tibetan language was one of them and thus it began.
In the past few weeks, I used the same strategy by researching at the statistics department websites of various countries where the Tibetan diaspora reside. My assumption that the census of other countries would be as detailed as Canada was completely wrong. Gathering data was challenging but it was equally challenging to verify and cross-check some of these numbers. This two page document (download pdf) titled "Data Sources: Demography of Tibetan Populations" from Columbia University provides a list of recommended sources. All my findings are shared in the sections of the respective countries. It was towards the end I found this amazing resource - Global Nomads: The Emergence of the Tibetan Diaspora - which was written in 2008 and one of the author is a dear friend and cousin! It provides a great overview of the entire Tibetan diaspora community with historical insights. For most of the diaspora communities where I could not find any figures, I used their numbers.
This project is still on-going as it is still missing or lacks updated data from many diaspora communities. More importantly, I may even have made mistakes in the data collection so I will be updating this page as more information is gathered. I hope the readers from the diaspora countries will help in collecting (or correcting) proper numbers for their respective communities. Thanks!
Overview
There are 6,411,911 Tibetans in the world. As most of the census is taken around 2010, I would assume the number to be just around 7 million today. The table below breaks down this population. Once again, please understand the assumptions baked into these values.
As expected, 98% of the Tibetan population resides in Tibet. By Tibet, I mean the three regions (Amdo, Kham and U-Tsang). China has strategically divided these three historical regions in TAR, Sichuan, Qinghai and other neighboring provinces. You can click on the respective countries to see their detailed breakdown and sources. As you can see from the source column, I rely heavily on the research of Global Nomads: The Emergence of the Tibetan Diaspora.
| Country | Population | Percentage | Source |
|---|---|---|---|
| Tibet | 6,282,187 | 97.98% | 2010 China Census |
| India | 94,203 | 1.47% | 2009 CTA Demographic Survey of Tibetans in Exile |
| Nepal | 13,514 | 0.211% | 2009 CTA Demographic Survey of Tibetans in Exile |
| USA | 11,265 | 0.176% | 2013 American Community Survey 5-yr estimates |
| Canada | 4,640 | 0.072% | 2011 Canada Census |
| Switzerland | 1540 | 0.024% | 1998 CTA Survey* |
| Bhutan | 1,298 | 0.020% | 2009 CTA Demographic Survey of Tibetans in Exile |
| United Kingdom | 650 | 0.010% | 2008 Office of Tibet, London (personal communication)* |
| Rest of Europe (excluding Switzerland and Scandanavia) | 640 | 0.010% | 1998 CTA Survey* |
| Australia | 533 | 0.008% | 2006 Australian Census* |
| Taiwan | 485 | 0.008% | Taiwan Mongol and Tibetan Affairs |
| Scandanavia | 110 | 0.002% | 1998 CTA Survey* |
| New Zealand | 66 | 0.001% | 2006 New Zealand Census* |
| Japan | 60 | 0.001% | 1998 CTA Survey* |
The pie graph below illustrates the significant percentage of Tibetans inside Tibet in contrast to the small diaspora community. Although some diaspora numbers are not updated, the growth rate of Tibetan population would be much higher due to its much greater population and dwarf any increase in the smaller diaspora community.
Tibet
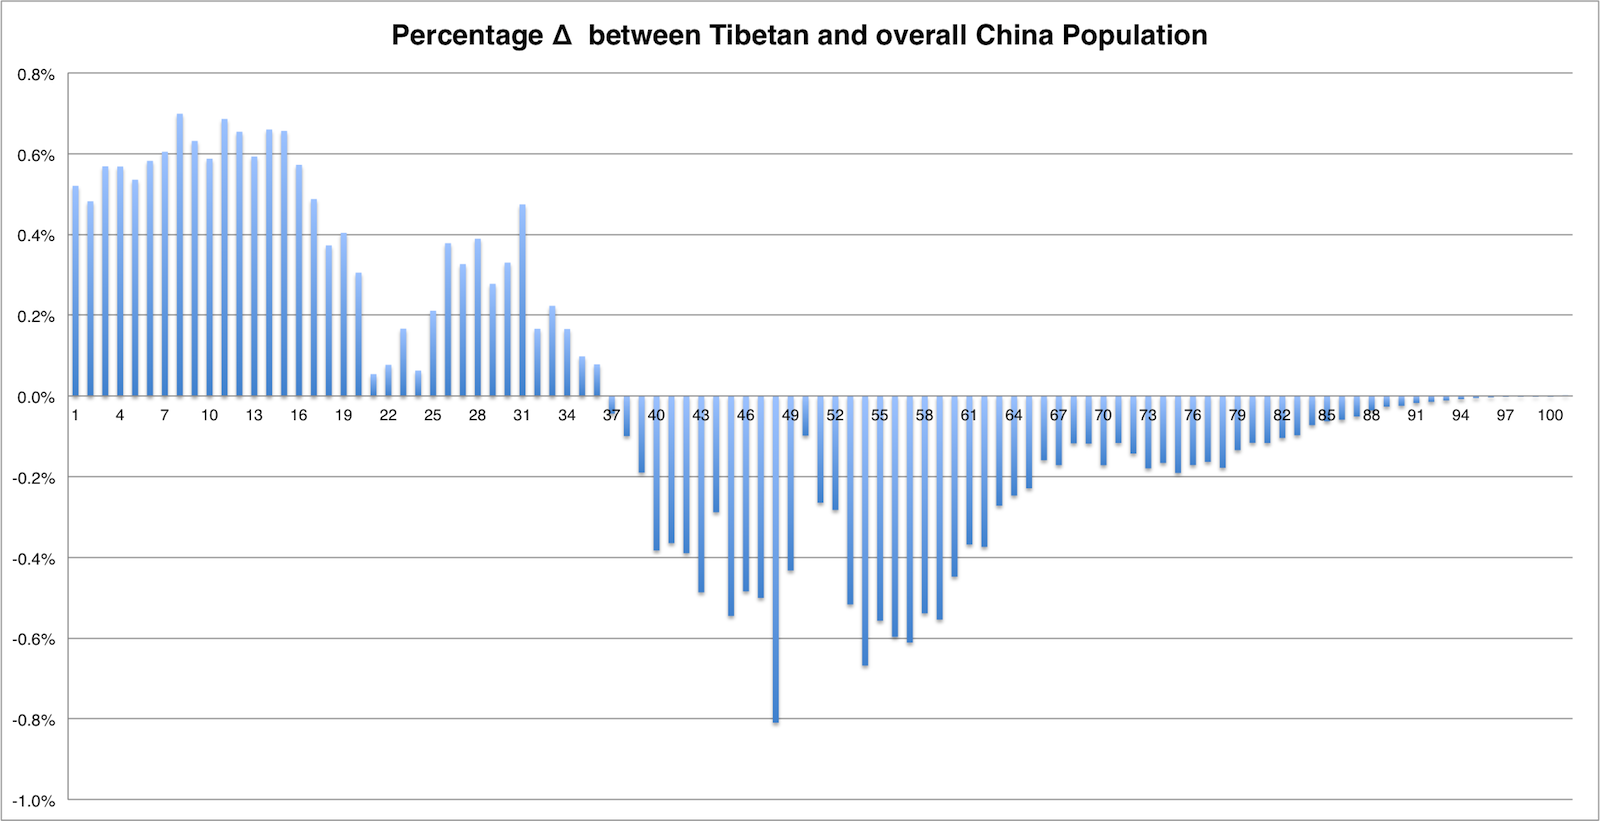
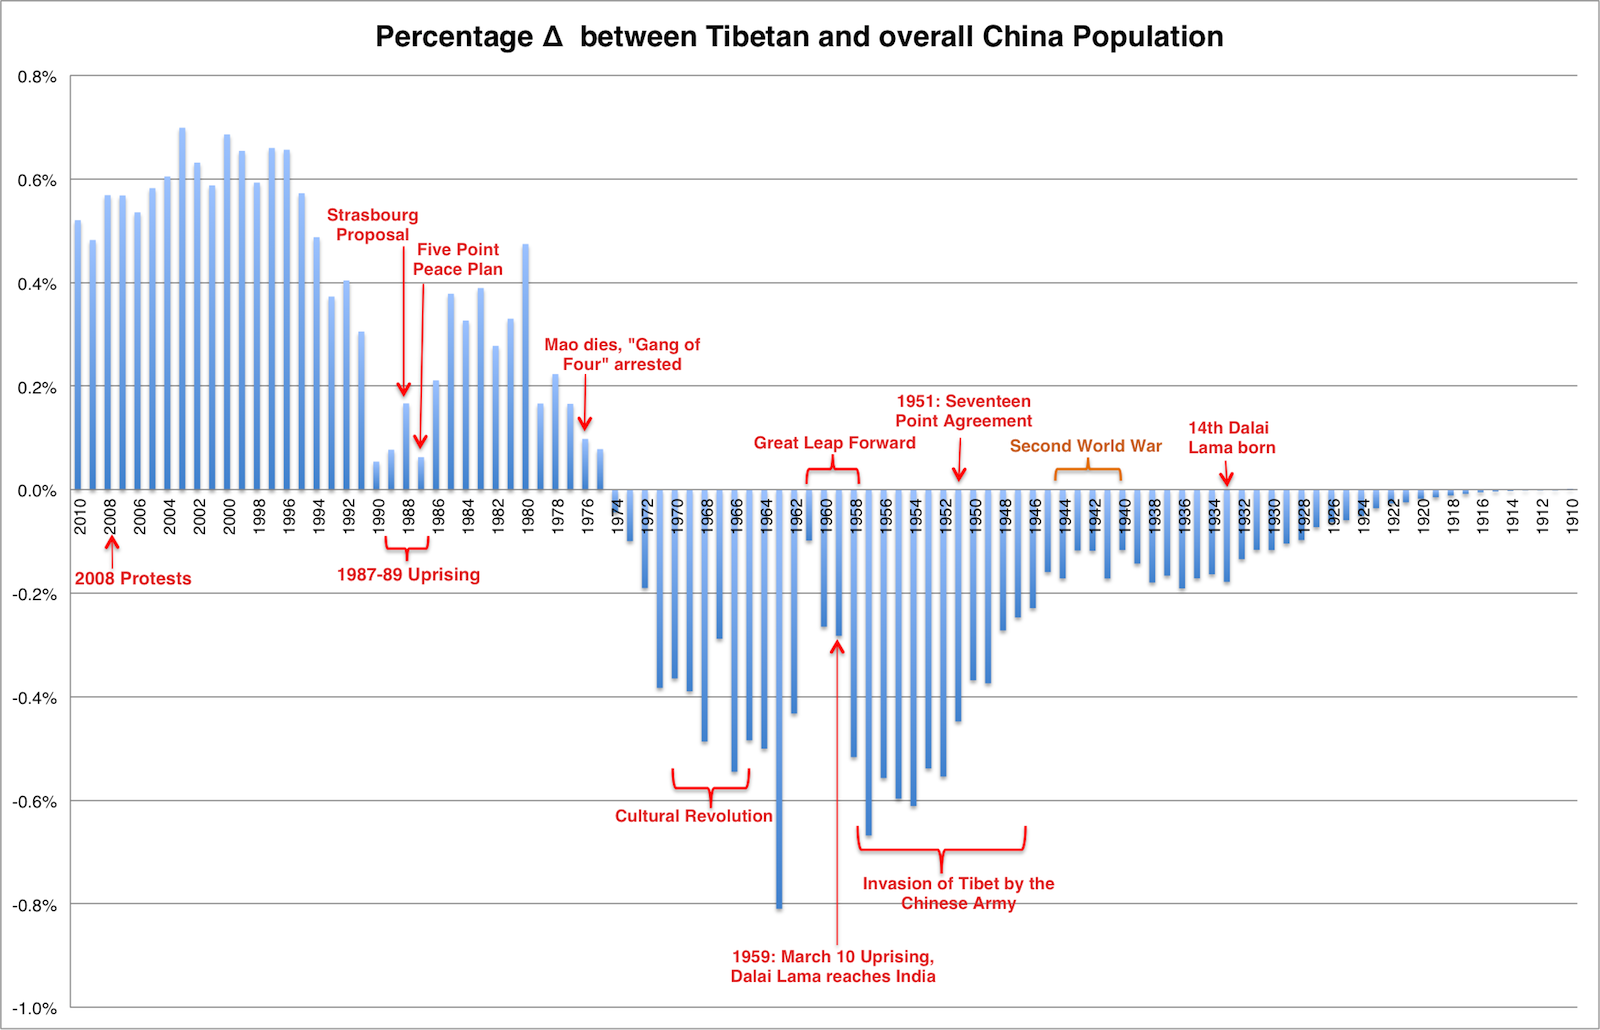
The source for this data was the 2010 population census of China. This census showed that there were 6,282,187 Tibetans with 3,155,625 males and 3,126,562 females. Let's start by looking at the standard population pyramid.
The population pyramid shows that the Tibetan population is mostly young. In fact, 35.27% of them are under 19 years old while 54.69% are under 29 years old! The 2010 world population has a similar breakdown - 35.33% and 52.06% for ages 19 & under and age 29 & under respectively. However, when we look at the population of China alone (Tibetan population included), only 24.10% are age 19 & under while 41.24% are age 29 & under! These differences mean that for both these age groups (19 & under and 29 & under) in China - the population of Tibetans is greater by ~46% and ~33% respectively. These numbers are shown in the table below.
Due to such high variance, it was necessary to take a deeper dive into these age groups. This was accomplished in the following two steps:
Diaspora Communities
For the diaspora communities, I will only go in detail where data is provided. Once again, please note that there are missing data and for all the collected data, the census years were closer to 2010 (so close to five years behind).
India, Nepal and Bhutan
The Tibet population discussed above was from the year 2010. The CTA conducted a world-wide demographic survey of Tibetans in early 2009. Although I have not read the actual report (my small circle of friends do not seem to have a copy, if you do - we could potentially be best mates), I did find the press releases [Phayul, Tibet Post, Hindustan Times]. The population numbers for these three countries are much lower than projected as seen in the table below. However, the challenges of such a task cannot be underestimated. In fact, this survey was carried out to know the "status of all the Tibetans in exile in various aspects of development, including social, financial, educational and health for the last 50 years." For Tibetans in Nepal, the United Nations High Commissioner for Refugees ("UNHCR") puts the number around 15,000 as found in their 2013 UNHCR Statistical Yearbook.
| Country | Initial Projection | Actual Population |
|---|---|---|
| India | 101,242 | 94,203 |
| Nepal | 16,313 | 13,514 |
| Bhutan | 1,883 | 1,298 |
| Rest of world | 25,712 | 18,920 |
The explanation for such low projection could be using the Green book as an identification card. Most diaspora Tibetans tend to update it when closer to an election (although keep in mind this is a recent trend as elections are a recent introduction). I am speculating here so please feel free to correct me.
Regarding the rest of world population, I avoided using this figure in hope of calculating a more accurate figure. However, I was not successful and after researching a few times, I have decided to use certain figures based on past findings. Also, I did not have access to the CTA's 2009 Demographic Survey which would have provided breakdown of diaspora communities outside of India, Nepal and Bhutan.
USA
The initial source for this dataset was the American Community Survey ("ACS") data. I used the Excel file titled "Detailed Language Spoken at Home and Ability to Speak English for the Population 5 Years and Older by States: 2006-2008". This data was collected in 2008 and provides breakdown for different ancestor languages, including Tibetan. Some challenges for capturing such data, especialy for diaspora Tibetans is explained here. The latest dataset I have used is the 2013 ACS 5-yr estimates. This "5-yr estimates" combines five years of data collection into a five-year rolling average and is therefore statistically more robust compared to its 1-yr and 3-yr estimates (larger sample size). However, this 5-yr estimate does not show the Tibetan language as a separate line item so I had to use some estimates on my own.
| Survey | Number of Speakers | Margin of Error | Percentage |
|---|---|---|---|
| 2008 ACS | |||
| Asian & Pacific Island Languages ("A&PIL") | 8,267,977 | 30,947 | |
| Tibetan | 9,764 | 1,679 | Tibetan language is 0.118% of A&PIL |
| 2013 ACS 5-yr estimates | |||
| Asian & Pacific Island Languages | 9,539,099 | 23,440 | |
| Tibetan - Not provided | 11,265* |
Canada
The 2011 Canada Census data was the easiest one to collect. The census broke down the data for every language spoken at home. The only point of contention was there were two Tibetan languages - "Sino-Tibetan" and "Tibetan". For purpose of this project, I picked the "Tibetan" language. I was also able to collect more granular data to break it down for the major provinces. All the data and their sources are shared in the Excel file at the bottom of the page.
Taiwan
Based on this report (download PDF here) by a professor at Fooyin University, the 2009 Demographic Survey of Tibetans in Exile conducted by the CTA puts the total number of Tibetans in Taiwan at 241. However, the Mongol and Tibetan Affairs Commission put the figure closer to 485.
I visited Taiwan's 2010 Population and Housing Census site. There was a PDF file under Abstract Report > I. Resident Population > 4. Language Usage titled "Languages used at home for the resident nationals aged 6 years and over (XLS)". Unfortunately, they do not mention Tibetan.
Switzerland / UK / Scandanavia / Rest of Europe / Japan / New Zealand / Australia
I spent some time researching on most of these countries' statistics sites. Unable to find the detailed data I need, I resorted to use data from Table 1 of Global Nomads: The Emergence of the Tibetan Diaspora . I will update it once I am able to get my hands on the 2009 CTA Demographic Survey of Tibetans in Exile. Below, I have listed the census sites and files (where possible) for some countries I researched:
Concluding thoughts:
Data:
You can view or download the excel file on Google Drive here (updated as of May 22, 2015).